Using the Chrome Debugger: Difference between revisions
| (5 intermediate revisions by the same user not shown) | |||
| Line 5: | Line 5: | ||
AppStudio programs run in a browser. While the final target for the app may be a device like an iPhone or iPad, it's convenient to test the program on the desktop. Most any browser will work, but we have found the debugging tools on Google's Chrome work well and are easy to use. | AppStudio programs run in a browser. While the final target for the app may be a device like an iPhone or iPad, it's convenient to test the program on the desktop. Most any browser will work, but we have found the debugging tools on Google's Chrome work well and are easy to use. | ||
If you would prefer to use Safari's debugger, Apple has some [ | If you would prefer to use Safari's debugger, Apple has some [https://developer.apple.com/safari/tools/ excellent documentation]. | ||
When you click on Run in the IDE, your app is bundled into a web page, which is then opened in Chrome. You'll use the JavaScript Console to debug your program. | When you click on Run in the IDE, your app is bundled into a web page, which is then opened in Chrome. You'll use the JavaScript Console to debug your program. | ||
| Line 32: | Line 32: | ||
Here is how to open the JavaScript Console: | Here is how to open the JavaScript Console: | ||
* Select the menu icon at the top-right of your browser window, then select Tools -> Developer Tools. (Shortcut: Windows: Control-Shift- | * Select the menu icon at the top-right of your browser window, then select Tools -> Developer Tools. (Shortcut: Windows: Control-Shift-I or F12; Mac: Option-Command-J) | ||
* Select the Console tab | |||
* In the bottom panel, you should see "Uncaught ReferenceError: B is not defined. | * In the bottom panel, you should see "Uncaught ReferenceError: B is not defined. | ||
* Click browse.htm:20 link to the right (it may look at bit different on your system), and the offending code will display. (You may need to do a browser refresh to get the full source to appear) | * Click browse.htm:20 link to the right (it may look at bit different on your system), and the offending code will display. (You may need to do a browser refresh to get the full source to appear) | ||
| Line 96: | Line 97: | ||
[[File:TT10.05.png]] | [[File:TT10.05.png]] | ||
In the above screen, we have selected the " | In the above screen, we have selected the "Application" tab along the top of the Console. The Northwind database has been expanded to show what tables are in it: we have selected Customers Selecting that causes the records in that table to be displayed. | ||
=== Looking at the Cache === | === Looking at the Cache === | ||
| Line 111: | Line 112: | ||
[[File:TT10.08.JPG]] | [[File:TT10.08.JPG]] | ||
=== Testing Different Screen Sizes === | |||
The Chrome Debugger makes it easy to see how your app will look on different screen sizes. This is very useful if you are using [[Responsive Design Made Simple|responsive design]] to build your app. | |||
To use this, open the Chrome Debugger and click on the icon highlighted in red as shown: | |||
[[File:Chromedebuggerdevice.png]] | |||
On the top bar, you can select from a list of popular devices (iPhone, iPads, Nexus) or select Responsive, which allows you to dynamically resize the screen. | |||
=== On Device Debugging === | === On Device Debugging === | ||
Latest revision as of 17:29, 31 March 2020
Purpose
The purpose of this tutorial is to demonstrate how to use Google's Chrome browser to debug your AppStudio app.
AppStudio programs run in a browser. While the final target for the app may be a device like an iPhone or iPad, it's convenient to test the program on the desktop. Most any browser will work, but we have found the debugging tools on Google's Chrome work well and are easy to use.
If you would prefer to use Safari's debugger, Apple has some excellent documentation.
When you click on Run in the IDE, your app is bundled into a web page, which is then opened in Chrome. You'll use the JavaScript Console to debug your program.
Got a useful debugging tip? Let us know!
How to use the Chrome Debugger
Finding Errors in your Program
Let's create a short program with an error and see how it works.
Enter this program:
A = "This is a string"
A = A + B
MsgBox A
This program won't work. The variable B in the second line does not have a value.
Run the program. A blank browser window will appear. The MsgBox statement is not executed. Let's open the Console and find out what is going on.
The JavaScript Console
AppStudio programs are run by the JavaScript engine in the browser. You will be looking at your program translated to JavaScript: but don't get too stressed. Most of the code will look very much like your original program.
Here is how to open the JavaScript Console:
- Select the menu icon at the top-right of your browser window, then select Tools -> Developer Tools. (Shortcut: Windows: Control-Shift-I or F12; Mac: Option-Command-J)
- Select the Console tab
- In the bottom panel, you should see "Uncaught ReferenceError: B is not defined.
- Click browse.htm:20 link to the right (it may look at bit different on your system), and the offending code will display. (You may need to do a browser refresh to get the full source to appear)
Here is what you will see:
There is a lot of information here, but it's easy to see what the problem is. Simply fix it and run the problem again.
Tracing and Breakpoints
You can force your program to stop execution, then examine useful information in the Console. There are two ways to stop the program: you can put a special statement into your code before you run the program, or you can use the Console to add a breakpoint once it is running. Let's give this a try.
Enter this code (or load sample "Tutorial 10.txt")
count=0

Function btnClick_onclick()
  Dim s
  s="This is a local string"
  count=count+1
  txtTotal.value=count
  debugger
End Function
Now run it, and open the JavaScript Console. If you do not have the Console open, the Debugger statement will be ignored. Click on "My Button" so button_down gets called.
There are a number of interesting things to observe here.
- In the Code Window, you can see the debugger statement is highlighted.
- On the right, you can see the Call Stack, showing how execution got to the debugger statement.
- You can also see local variables. The variable s is shown with its value.
- If you hover the pointer over a variable name, its value will be displayed.
- If you enter a variable name into the lower panel, its value will be displayed.
- Global variables (like count in this example, can also be examined in the "Local" window on the right. Click on the triangle beside the work "this" and it will expand to show all globals.
Hit F8 to continue execution. Other shortcuts here are
- Step over: F10
- Step into: F11
- Step out: Shift-F11
Setting a breakpoint at runtime
You can set a breakpoint at runtime by clicking on its line number in the Code Window.
If you right click on the blue breakpoint indicator you created in the line number column, you can set a condition under which the breakpoint is effective. It will then turn orange. In this case, the breakpoint condition has been set to "count>10".
Using F8, execution has been continued until the breakpoint is reached. Once again, variable's values can be checked, etc.
Examining Databases
AppStudio programs save data into SQLite databases (See TechNote 15). Using the JavaScript Console, you can examine the current information in the database. It's a good way to check if your program is writing the correct information out.
If you click on the database itself, you see an empty window area with a prompt on the right hand side. There you can enter SQL statements directly, e.g. Copy/paste them from your program for testing, or do a "select * from <tablename>" to see the effect of your statements inside a table. You can also click on the table on the left, this also shows the data inside the table.
In the above screen, we have selected the "Application" tab along the top of the Console. The Northwind database has been expanded to show what tables are in it: we have selected Customers Selecting that causes the records in that table to be displayed.
Looking at the Cache
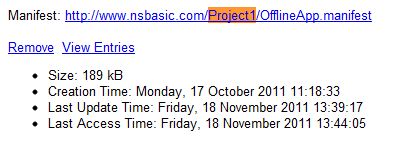
When an AppStudio app is run, it saves its files to the local system so it can run even if not connected to the net. You can examine the files in Chrome by browsing to chrome://appcache-internals/. You'll see one entry for each app which is storing local files:
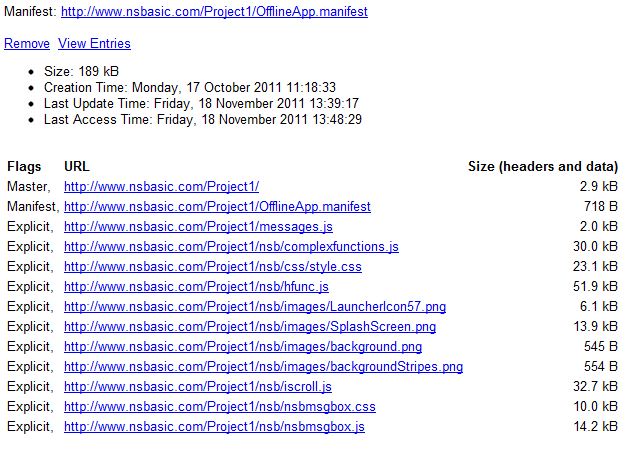
If you select the entry for an app, you'll see the following:
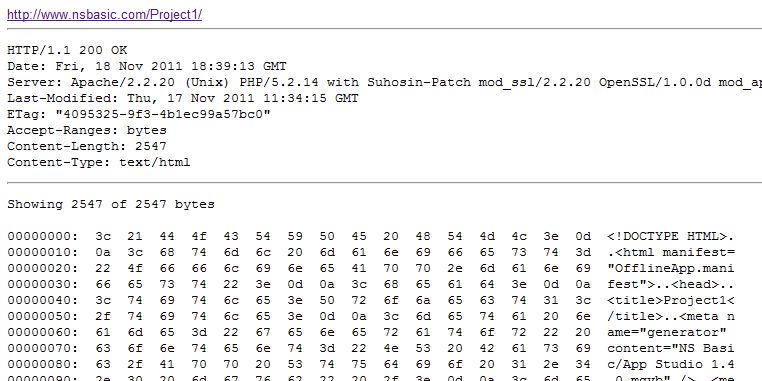
You can even look at the contents of individual files:
Testing Different Screen Sizes
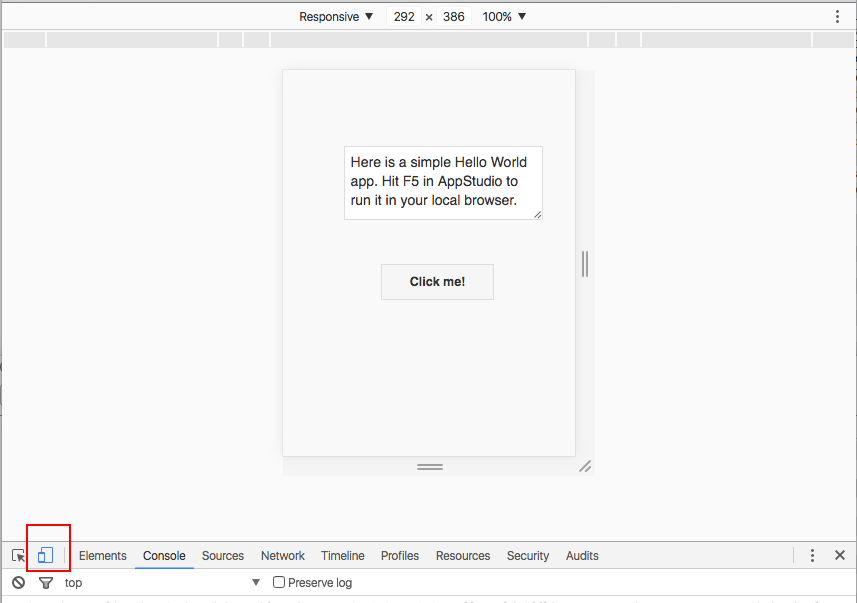
The Chrome Debugger makes it easy to see how your app will look on different screen sizes. This is very useful if you are using responsive design to build your app.
To use this, open the Chrome Debugger and click on the icon highlighted in red as shown:
On the top bar, you can select from a list of popular devices (iPhone, iPads, Nexus) or select Responsive, which allows you to dynamically resize the screen.
On Device Debugging
Debugging an Android device on Windows
You will need Chrome 32 or later on both the device and the desktop. Your device needs to be connected by its USB cable.
Follow the instructions here. You will probably need to install the USB driver for your device. Once it is installed, type about:inspect into Chrome’s url bar and you will connect. The debugger will work just like the Chrome Desktop Debugger.
Debugging an Android device on Mac OS
Just like on Windows, except there are no drivers to install.


