AppStudio Server Debugger: Difference between revisions
No edit summary |
|||
| Line 35: | Line 35: | ||
This screen identifies the current session. The device needs to have an active WiFi connection to communicate with the PhoneGap's debug server. Your desktop is logged into that same server to get the information from the device. | This screen identifies the current session. The device needs to have an active WiFi connection to communicate with the PhoneGap's debug server. Your desktop is logged into that same server to get the information from the device. | ||
[[File:PhoneGapDebug3.png]] | [[File:PhoneGapDebug3.png|center|400px]] | ||
The Console tab works very much like the Console tab on the Chrome debugger. Use this to view error messages and enter console commands. Since commands you type are sent to PhoneGap's debug server and then on to the device, it can take a few seconds to get the result of something you type. | The Console tab works very much like the Console tab on the Chrome debugger. Use this to view error messages and enter console commands. Since commands you type are sent to PhoneGap's debug server and then on to the device, it can take a few seconds to get the result of something you type. | ||
Revision as of 13:28, 24 September 2013
Once an app is packaged into a native app using PhoneGap, the usual debugging techniques, such as the Chrome Debugger, cannot be used. It can also be difficult to debug an app running on a device.
The PhoneGap Debugger is a huge help. Here's how to use it.
[Note: you'll need a full license to AppStudio to do this. You'll need a PhoneGap Build account, which is not supported by the AppStudio Demo.]
Upload your app to PhoneGap Build
Use "Build Native App with PhoneGap" on AppStudio's Run menu.
Log into your PhoneGap Build Apps page
Use "Start PhoneGap Debugger" on the Run menu.
Turn Debugging on for your App
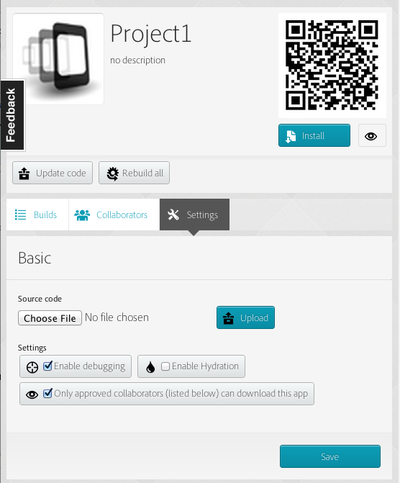
In the PhoneGap App page, select your project. In Settings, set the "Enable Debugging" checkbox and save. You will only have to do this once: it will remember the setting next time you upload this app.
Rebuild your App
This will build your project again with the debug code added to it.
Install your App on your device
Once the rebuild is done, download your app and start it on your device.
Start the Debugger
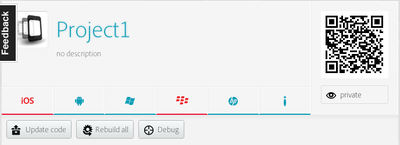
On the PhoneGap Build App screen, you'll see a new option for Debug. Click on it.

Debugger is now Active
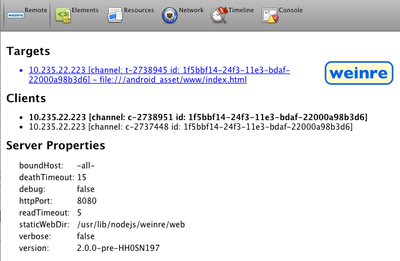
This screen identifies the current session. The device needs to have an active WiFi connection to communicate with the PhoneGap's debug server. Your desktop is logged into that same server to get the information from the device.

The Console tab works very much like the Console tab on the Chrome debugger. Use this to view error messages and enter console commands. Since commands you type are sent to PhoneGap's debug server and then on to the device, it can take a few seconds to get the result of something you type.

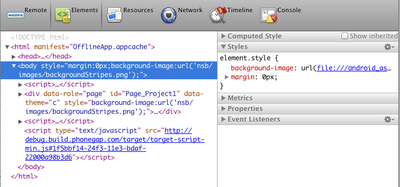
The Elements tab shows the elements and scripts of the app.

The Resources tab lets you look at values in localStorage and databases.

