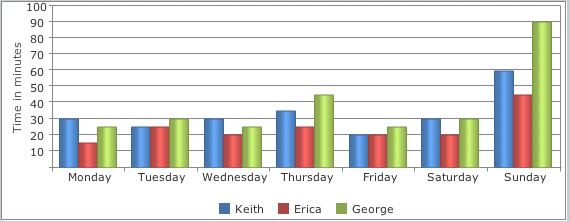
JqxChart
Description
jqxChart is an easy to use chart widget based on the popular jQuery library.
Properties and Methods
See the complete documentation at jqWidget's site: http://www.jqwidgets.com/jquery-widgets-documentation/documentation/jqxgrid/jquery-grid-getting-started.htm
Example
Dim data, source, dataAdapter
data = generatedata(50)     'generatedata is a function which returns grid data
source = {localdata: data, datatype: "array"}
dataAdapter = new $.jqx.dataAdapter(source)

Grid1_settings.source = dataAdapter
Grid1_settings.columns = [ _
    { text: "First Name", dataField: "firstname", width: 100 }, _
    { text: "Last Name", dataField: "lastname", width: 100 }, _
    { text: "Product", dataField: "productname", width: 180 }, _
    { text: "Quantity", dataField: "quantity", width: 80, cellsalign: "right" }, _
    { text: "Unit Price", dataField: "price", width: 90, cellsalign: "right", cellsformat: "c2" }, _
    { text: "Total", dataField: "total", cellsalign: "right", minwidth: 100, cellsformat: "c2" } _
  ]
Output
See above.
